
Page 604 - Read Online
P. 604
Dave et al. J Cancer Metastasis Treat 2020;6:46 I http://dx.doi.org/10.20517/2394-4722.2020.106 Page 21 of 36
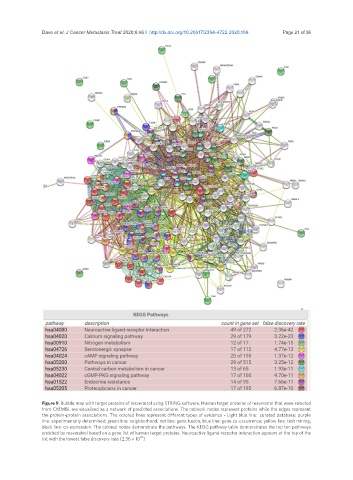
Figure 9. Bubble map with target proteins of resveratrol using STRING software. Human target proteins of resveratrol that were selected
from ChEMBL are visualized as a network of predicted associations. The network nodes represent proteins while the edges represent
the protein-protein associations. The colored lines represent different types of evidence - Light blue line: curated database; purple
line: experimentally determined; green line: neighborhood; red line: gene fusion; blue line: gene co-occurrence; yellow line: text mining;
black line: co-expression. The colored nodes demonstrate the pathways. The KEGG pathway table demonstrates the top ten pathways
enriched by resveratrol based on a gene list of human target proteins. Neuroactive ligand-receptor interaction appears at the top of the
42
list with the lowest false discovery rate (2.36 × 10 )