
Page 633 - Read Online
P. 633
Page 4 of 8 Adeyemi et al. J Cancer Metastasis Treat 2018;4:53 I http://dx.doi.org/10.20517/2394-4722.2018.12
Table 2. The secondary cancer complication probability (linear, linear-
exponent, plateau) indices for different organs
Models Contralateral breast (%) Lung (%) Chest wall (%)
Linear 0.93 ± 0.24 5.93 ± 0.54 31.96 ± 2.08
Linear exponent 0.41 ± 0.05 0.34 ± 0.03 0.65 ± 0.06
Plateau 0.48 ± 0.07 1.81 ± 0.12 4.83 ± 0.26
Table 3. Correlation of dose volume histogram parameters of breasts, chest
walls and lungs with the secondary cancer complication probability
Linear Linear-exponent Linear-plateau
Contralateral breast
Max dose 0.437 0.179 0.546 *
Min dose 0.387 0.124 0.487 *
Mean dose 0.418 0.170 0.606 **
Volume -0.113 -0.293 -0.139
EUD - - -
Lung
Max dose 0.318 0.096 0.283
Min dose 0.711** 0.390 0.803**
Mean dose 0.912** -0.125 0.870**
Volume -0.217 -0.059 -0.179
EUD 0.759** -0.079 0.732**
Chest wall
Max dose 0.040 0.085 0.059
Min dose 0.936** 0.217 0.830**
Mean dose 0.989** 0.361 0.870**
Volume -0.373 -0.869** -0.469*
EUD - - -
*P < 0.05; **P < 0.01. EUD: equivalent uniform dose
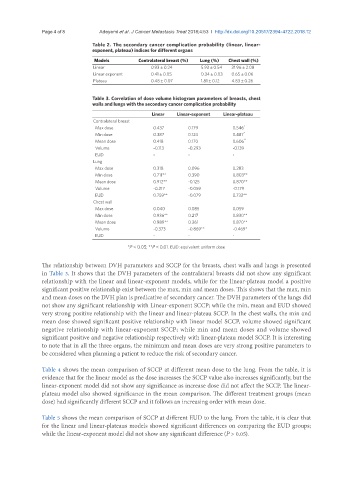
The relationship between DVH parameters and SCCP for the breasts, chest walls and lungs is presented
in Table 3. It shows that the DVH parameters of the contralateral breasts did not show any significant
relationship with the linear and linear-exponent models, while for the linear-plateau model a positive
significant positive relationship exist between the max, min and mean doses. This shows that the max, min
and mean doses on the DVH plan is predicative of secondary cancer. The DVH parameters of the lungs did
not show any significant relationship with Linear-exponent SCCP; while the min, mean and EUD showed
very strong positive relationship with the linear and linear-plateau SCCP. In the chest walls, the min and
mean dose showed significant positive relationship with linear model SCCP, volume showed significant
negative relationship with linear-exponent SCCP; while min and mean doses and volume showed
significant positive and negative relationship respectively with linear-plateau model SCCP. It is interesting
to note that in all the three organs, the minimum and mean doses are very strong positive parameters to
be considered when planning a patient to reduce the risk of secondary cancer.
Table 4 shows the mean comparison of SCCP at different mean dose to the lung. From the table, it is
evidence that for the linear model as the dose increases the SCCP value also increases significantly, but the
linear-exponent model did not show any significance as increase dose did not affect the SCCP. The linear-
plateau model also showed significance in the mean comparison. The different treatment groups (mean
dose) had significantly different SCCP and it follows an increasing order with mean dose.
Table 5 shows the mean comparison of SCCP at different EUD to the lung. From the table, it is clear that
for the linear and linear-plateaus models showed significant differences on comparing the EUD groups;
while the linear-exponent model did not show any significant difference (P > 0.05).