Page 293 - Read Online
P. 293

Eto et al. J Cancer Metastasis Treat 2018;4:23  I  http://dx.doi.org/10.20517/2394-4722.2017.73                                   Page 3 of 9

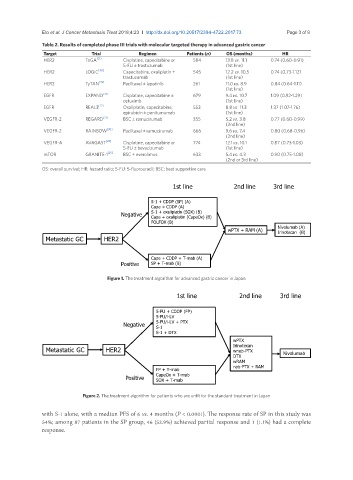
               Table 2. Results of completed phase III trials with molecular targeted therapy in advanced gastric cancer
                Target          Trial           Regimen         Patients (n)  OS (months)       HR
                HER2          ToGA [21]    Cisplatine, capecitabine or   584  13.8 vs. 11.1  0.74 (0.60-0.91)
                                           5-FU ± trastuzumab                (1st line)
                HER2          LOGiC [48]   Capecitabine, oxaliplatin ±   545  12.2 vs. 10.5  0.74 (0.73-1.12)
                                           trastuzumab                       (1st line)
                HER2          TyTAN [49]   Paclitaxel ± lapatinib  261       11.0 vs. 8.9    0.84 (0.64-1.11)
                                                                             (1st line)
                EGFR          EXPAND [26]  Cisplatine, capecitabine ±   679  9.4 vs. 10.7   1.09 (0.92-1.29)
                                           cetuximb                          (1st line)
                EGFR          REAL3 [27]   Oxaliplatin, capecitabine,   553  8.8 vs. 11.3   1.37 (1.07-1.76)
                                           epirubicin ± panitumumab          (1st line)
                VEGFR-2       REGARD [31]  BSC ± ramucirumab      355        5.2 vs. 3.8    0.77 (0.60-0.99)
                                                                             (2nd line)
                VEGFR-2       RAINBOW [30]  Paclitaxel ± ramucirumab  665    9.6 vs. 7.4    0.80 (0.68-0.96)
                                                                             (2nd line)
                VEGFR-A       AVAGAST [24]  Cisplatine, capecitabine or   774  12.1 vs. 10.1  0.87 (0.73-1.03)
                                           5-FU ± bevacizumab                (1st line)
                mTOR          GRANITE-1 [25]  BSC ± everolimus    633        5.4 vs. 4.3    0.90 (0.75-1.08)
                                                                             (2nd or 3rd line)
               OS: overall survival; HR: hazard ratio; 5-FU: 5-fluorouracil; BSC: best supportive care

                                                           1st line             2nd line     3rd line


                                                    S-1 + CDDP (SP) (A)
                                                    Cape + CDDP (A)
                                          Negative  S-1 + oxaliplatin (SOX) (B)
                                                    Cape + oxaliplatin (CapeOx) (B)
                                                    FOLFOX (B)
                                                                              wPTX + RAM (A)   Nivolumab (A)
                                                                                               Irinotecan  (B)
                Metastatic GC       HER2


                                                    Cape + CDDP + T-mab (A)
                                          Positive  SP + T-mab (B)

                                     Figure 1. The treatment algorithm for advanced gastric cancer in Japan

                                                             1st line             2nd line     3rd line


                                                      5-FU + CDDP (FP)
                                                      5-FU/l-LV
                                           Negative   5-FU/l-LV + PTX
                                                      S-1
                                                      S-1 + DTX
                                                                                wPTX
                                                                                Irinotecan
                Metastatic GC        HER2                                       wnab-PTX        Nivolumab
                                                                                DTX
                                                                                wRAM
                                                                                nab-PTX + RAM
                                                      FP + T-mab
                                                      CapeOx + T-mab
                                           Positive   SOX + T-mab


                             Figure 2. The treatment algorithm for patients who are unfit for the standard treatment in Japan

               with S-1 alone, with a median PFS of 6 vs. 4 months (P < 0.0001). The response rate of SP in this study was
               54%; among 87 patients in the SP group, 46 (52.9%) achieved partial response and 1 (1.1%) had a complete
               response.
   288   289   290   291   292   293   294   295   296   297   298