
Page 60 - Read Online
P. 60
Lue et al. J Cancer Metastasis Treat 2022;8:11 https://dx.doi.org/10.20517/2394-4722.2021.193 Page 3 of 25
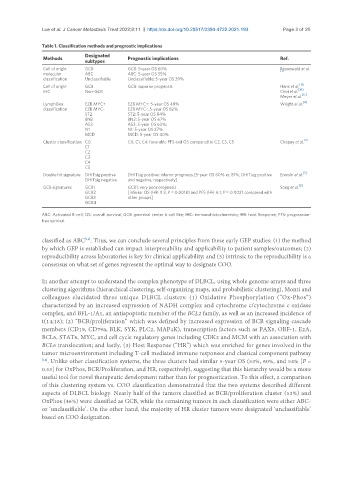
Table 1. Classification methods and prognostic implications
Designated
Methods Prognostic implications Ref.
subtypes
Cell of origin: GCB GCB: 5-year OS 60% Rosenwald et al.
[1]
molecular ABC ABC: 5-year OS 35%
classification Unclassifiable Unclassifiable: 5-year OS 39%
Cell of origin: GCB GCB: superior prognosis Hans et al. [15]
[16]
IHC Non-GCB Choi et al.
[17]
Meyer et al.
LymphGen EZB MYC+ EZB MYC+: 5-year OS 48% Wright et al. [4]
classification EZB MYC- EZB MYC-: 5-year OS 82%
ST2 ST2: 5-year OS 84%
BN2 BN2: 5-year OS 67%
A53 A53: 5-year OS 63%:
N1 N1: 5-year OS 27%
MCD MCD: 5-year OS 40%
[3]
Cluster classification C0 C0, C1, C4: favorable PFS and OS compared to C2, C3, C5 Chapuy et al.
C1
C2
C3
C4
C5
Double hit signature DHITsig positive DHITsig positive: inferior prognosis [5-year OS 60% vs. 81%, DHITsig positive Ennishi et al. [5]
DHITsig negative and negative, respectively]
GCB signatures GCB1 GCB1: very poor prognosis Song et al. [6]
GCB2 [inferior OS (HR: 9.2; P = 0.0018) and PFS (HR: 6.1; P = 0.002) compared with
GCB3 other groups]
GCB4
ABC: Activated B-cell; OS: overall survival; GCB: germinal center b-cell like; IHC: immunohistochemistry; HR: host Response; PFS: progression-
free survival.
classified as ABC . Thus, we can conclude several principles from these early GEP studies: (1) the method
[13]
by which GEP is established can impact interpretability and applicability to patient samples/outcomes; (2)
reproducibility across laboratories is key for clinical applicability; and (3) intrinsic to the reproducibility is a
consensus on what set of genes represent the optimal way to designate COO.
In another attempt to understand the complex phenotype of DLBCL, using whole genome arrays and three
clustering algorithms (hierarchical clustering, self-organizing maps, and probabilistic clustering), Monti and
colleagues elucidated three unique DLBCL clusters: (1) Oxidative Phosphorylation (“Ox-Phos”)
characterized by an increased expression of NADH complex and cytochrome c/cytochrome c oxidase
complex, and BFL-1/A1, an antiapoptotic member of the BCL2 family, as well as an increased incidence of
t(14;18); (2) “BCR/proliferation” which was defined by increased expression of BCR signaling cascade
members (CD19, CD79a, BLK, SYK, PLC2, MAP4K), transcription factors such as PAX5, OBF-1, E2A,
BCL6, STAT6, MYC, and cell cycle regulatory genes including CDK2 and MCM with an association with
BCL6 translocation; and lastly, (3) Host Response (“HR”) which was enriched for genes involved in the
tumor microenvironment including T-cell mediated immune responses and classical component pathway
[14] . Unlike other classification systems, the three clusters had similar 5-year OS (53%, 60%, and 54% [P =
0.53] for OxPhos, BCR/Proliferation, and HR, respectively), suggesting that this hierarchy would be a more
useful tool for novel therapeutic development rather than for prognostication. To this effect, a comparison
of this clustering system vs. COO classification demonstrated that the two systems described different
aspects of DLBCL biology. Nearly half of the tumors classified as BCR/proliferation cluster (53%) and
OxPhos (46%) were classified as GCB, while the remaining tumors in each classification were either ABC-
or ‘unclassifiable’. On the other hand, the majority of HR cluster tumors were designated ‘unclassifiable’
based on COO designation.