
Page 62 - Read Online
P. 62
Porta et al. J Cancer Metastasis Treat 2021;7:49 https://dx.doi.org/10.20517/2394-4722.2021.86 Page 9 of 12
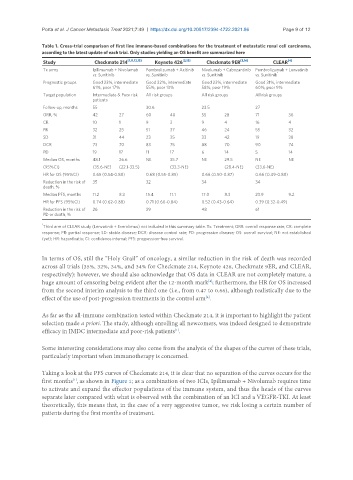
Table 1. Cross-trial comparison of first line immune-based combinations for the treatment of metastatic renal cell carcinoma,
according to the latest update of each trial. Only studies yielding an OS benefit are summarized here
Study Checkmate 214 [1,11,12,13] Keynote 426 [2,15] Checkmate 9ER [3,16] CLEAR [4]
Tx arms Ipilimumab + Nivolumab Pembrolizumab + Axitinib Nivolumab + Cabozantinib Pembrolizumab + Lenvatinib
*
vs. Sunitinib vs. Sunitinib vs. Sunitinib vs. Sunitinib
Prognostic groups Good 23%, intermediate Good 32%, intermediate Good 23%, intermediate Good 31%, intermediate
61%, poor 17% 55%, poor 13% 58%, poor 19% 60%, poor 9%
Target population Intermediate & Poor risk All risk groups All risk groups All risk groups
patients
Follow-up, months 55 30.6 23.5 27
ORR, % 42 27 60 40 55 28 71 36
CR 10 1 9 3 9 4 16 4
PR 32 25 51 37 46 24 55 32
SD 31 44 23 35 33 42 19 38
DCR 73 70 83 75 88 70 90 74
PD 19 17 11 17 6 14 5 14
Median OS, months 48.1 26.6 NE 35.7 NE 29.5 NE NE
(95%CI) (35.6-NE) (22.1-33.5) (33.3-NE) (28.4-NE) (33.6-NE)
HR for OS (95%CI) 0.65 (0.54-0.88) 0.68 (0.55-0.85) 0.66 (0.50-0.87) 0.66 (0.49-0.88)
Reduction in the risk of 35 32 34 34
death, %
Median PFS, months 11.2 8.3 15.4 11.1 17.0 8.3 23.9 9.2
HR for PFS (95%CI) 0.74 (0.62-0.88) 0.71 (0.60-0.84) 0.52 (0.43-0.64) 0.39 (0.32-0.49)
Reduction in the risk of 26 29 48 61
PD or death, %
*
Third arm of CLEAR study (Lenvatinib + Everolimus) not included in this summary table. Tx: Treatment; ORR: overall response rate; CR: complete
response; PR: partial response; SD: stable disease; DCR: disease control rate; PD: progressive disease; OS: overall survival; NE: not established
(yet); HR: hazard ratio; CI: confidence interval; PFS: progression-free survival.
In terms of OS, still the “Holy Grail” of oncology, a similar reduction in the risk of death was recorded
across all trials (35%, 32%, 34%, and 34% for Checkmate 214, Keynote 426, Checkmate 9ER, and CLEAR,
respectively): however, we should also acknowledge that OS data in CLEAR are not completely mature, a
[4]
huge amount of censoring being evident after the 12-month mark ; furthermore, the HR for OS increased
from the second interim analysis to the third one (i.e., from 0.47 to 0.66), although realistically due to the
effect of the use of post-progression treatments in the control arm .
[4]
As far as the all-immune combination tested within Checkmate 214, it is important to highlight the patient
selection made a priori. The study, although enrolling all newcomers, was indeed designed to demonstrate
efficacy in IMDC intermediate and poor-risk patients .
[1]
Some interesting considerations may also come from the analysis of the shapes of the curves of these trials,
particularly important when immunotherapy is concerned.
Taking a look at the PFS curves of Checkmate 214, it is clear that no separation of the curves occurs for the
first months , as shown in Figure 1; as a combination of two ICIs, Ipilimumab + Nivolumab requires time
[1]
to activate and expand the effector populations of the immune system, and thus the heads of the curves
separate later compared with what is observed with the combination of an ICI and a VEGFR-TKI. At least
theoretically, this means that, in the case of a very aggressive tumor, we risk losing a certain number of
patients during the first months of treatment.