
Page 237 - Read Online
P. 237
Page 4 of 7 Bonfiglio et al. J Cancer Metastasis Treat 2019;5:29 I http://dx.doi.org/10.20517/2394-4722.2018.88
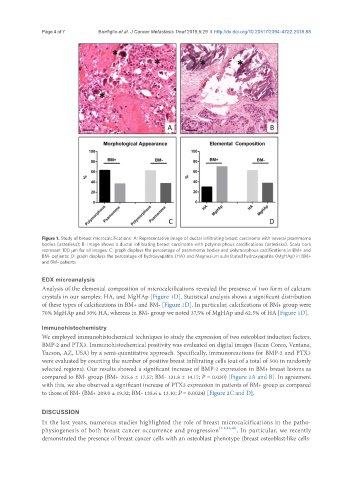
Figure 1. Study of breast microcalcifications. A: Representative image of ductal infiltrating breast carcinoma with several psammoma
bodies (asterisks); B: image shows a ductal infiltrating breast carcinoma with polymorphous calcifications (asterisks). Scala bars
represent 100 μm for all images; C: graph displays the percentage of psammoma bodies and polymorphous calcifications in BM+ and
BM- patients; D: graph displays the percentage of hydroxyapatite (HA) and Magnesium substituted hydroxyapatite (MgHAp) in BM+
and BM- patients
EDX microanalysis
Analysis of the elemental composition of microcalcifications revealed the presence of two form of calcium
crystals in our samples: HA, and MgHAp [Figure 1D]. Statistical analysis shows a significant distribution
of these types of calcifications in BM+ and BM- [Figure 1D]. In particular, calcifications of BM+ group were
70% MgHAp and 30% HA, whereas in BM- group we noted 37.5% of MgHAp and 62.5% of HA [Figure 1D].
Immunohistochemistry
We employed immunohistochemical techniques to study the expression of two osteoblast induction factors,
BMP-2 and PTX3. Immunohistochemical positivity was evaluated on digital images (Iscan Coreo, Ventana,
Tucson, AZ, USA) by a semi-quantitative approach. Specifically, immunoreactions for BMP-2 and PTX3
were evaluated by counting the number of positive breast infiltrating cells (out of a total of 500 in randomly
selected regions). Our results showed a significant increase of BMP-2 expression in BM+ breast lesions as
compared to BM- group (BM+ 205.6 ± 17.57; BM- 131.8 ± 14.17; P = 0.030) [Figure 2A and B]. In agreement
with this, we also observed a significant increase of PTX3 expression in patients of BM+ group as compared
to those of BM- (BM+ 209.0 ± 19.32; BM- 135.6 ± 13.10; P = 0.0024) [Figure 2C and D].
DISCUSSION
In the last years, numerous studies highlighted the role of breast microcalcifications in the patho-
physiogenesis of both breast cancer occurrence and progression [3-6,15,16] . In particular, we recently
demonstrated the presence of breast cancer cells with an osteoblast phenotype (breast osteoblast-like cells-