
Page 356 - Read Online
P. 356
Krastev et al. Hepatoma Res 2019;5:35 I http://dx.doi.org/10.20517/2394-5079.2019.02 Page 3 of 5
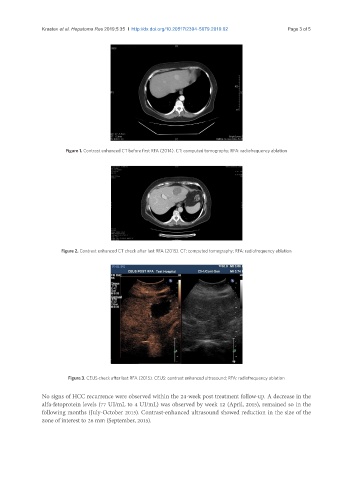
Figure 1. Contrast enhanced CT before first RFA (2014). CT: computed tomography; RFA: radiofrequency ablation
Figure 2. Contrast enhanced CT check after last RFA (2015). CT: computed tomography; RFA: radiofrequency ablation
Figure 3. CEUS check after last RFA (2015). CEUS: contrast enhanced ultrasound; RFA: radiofrequency ablation
No signs of HCC recurrence were observed within the 24-week post treatment follow-up. A decrease in the
alfa-fetoprotein levels (77 UI/mL to 4 UI/mL) was observed by week 12 (April, 2015), remained so in the
following months (July-October 2015). Contrast-enhanced ultrasound showed reduction in the size of the
zone of interest to 26 mm (September, 2015).