
Page 203 - Read Online
P. 203
Page 4 of 10 Zhao et al. Hepatoma Res 2019;5:17 I http://dx.doi.org/10.20517/2394-5079.2018.116
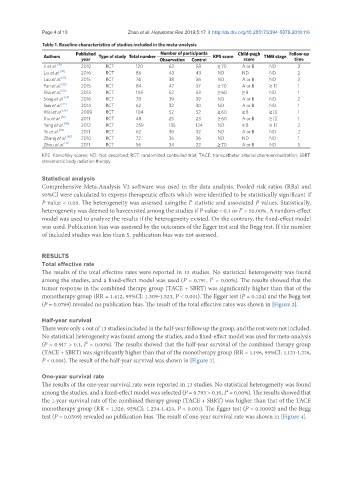
Table 1. Baseline characteristics of studies included in the meta-analysis
Published Number of participants Child-pugh Follow-up
Authors Type of study Total number KPS score TNM stage
year Observation Control score time
Ji et al. [29] 2010 RCT 120 62 58 ≥ 70 A or B ND 3
Liu et al. [30] 2016 RCT 86 43 43 ND ND ND 2
Luo et al. [31] 2015 RCT 74 38 36 ND A or B ND 2
Pan et al. [32] 2015 RCT 84 47 37 ≥ 70 A or B ≥ Ⅱ 1
Sha et al. [33] 2013 RCT 105 52 53 ≥ 60 ≥ B ND 1
Song et al. [34] 2016 RCT 78 39 39 ND A or B ND 2
Sun et al. [35] 2014 RCT 62 32 30 ND A or B ND 1
Wei et al. [36] 2009 RCT 104 52 52 ≥ 60 ≥ B ≥ Ⅲ 1
Xiu et al. [37] 2011 RCT 48 25 23 ≥ 60 A or B ≥ Ⅲ 1
Yang et al. [38] 2012 RCT 259 135 124 ND ≥ B ≥ Ⅱ 2
Ye et al. [39] 2011 RCT 62 30 32 ND A or B ND 2
Zhang et al. [40] 2010 RCT 72 36 36 ND ND ND 1
Zhou et al. [41] 2011 RCT 56 34 22 ≥ 70 A or B ND 5
KPS: Karnofsky scores; ND: Not described; RCT: randomized controlled trial; TACE: transcatheter arterial chemoembolization; SBRT:
stereotactic body radiation therapy
Statistical analysis
Comprehensive Meta-Analysis V2 software was used in the data analysis. Pooled risk ratios (RRs) and
95%CI were calculated to express therapeutic effects which were identified to be statistically significant if
P value < 0.05. The heterogeneity was assessed usingthe I statistic and associated P values. Statistically,
2
heterogeneity was deemed to haveexisted among the studies if P value < 0.1 or I > 50.00%. A random-effect
2
model was used to analyze the results if the heterogeneity existed. On the contrary, the fixed-effect model
was used. Publication bias was assessed by the outcomes of the Egger test and the Begg test. If the number
of included studies was less than 5, publication bias was not assessed.
RESULTS
Total effective rate
The results of the total effective rates were reported in 13 studies. No statistical heterogeneity was found
among the studies, and a fixed-effect model was used (P = 0.791, I² = 0.00%). The results showed that the
tumor response in the combined therapy group (TACE + SBRT) was significantly higher than that of the
monotherapy group (RR = 1.412, 95%CI: 1.309-1.523, P < 0.001). The Egger test (P = 0.124) and the Begg test
(P = 0.0769) revealed no publication bias. The result of the total effective rates was shown in [Figure 2].
Half-year survival
There were only 4 out of 13 studies included in the half-year follow up the group, and the rest were not included.
No statistical heterogeneity was found among the studies, and a fixed-effect model was used for meta-analysis
(P = 0.917 > 0.1, I² = 0.00%). The results showed that the half-year survival of the combined therapy group
(TACE + SBRT) was significantly higher than that of the monotherapy group (RR = 1.196, 95%CI: 1.121-1.276,
P < 0.001). The result of the half-year survival was shown in [Figure 3].
One-year survival rate
The results of the one-year survival rate were reported in 13 studies. No statistical heterogeneity was found
among the studies, and a fixed-effect model was selected (P = 0.793 > 0.10, I² = 0.00%). The results showed that
the 1-year survival rate of the combined therapy group (TACE + SBRT) was higher than that of the TACE
monotherapy group (RR = 1.326, 95%CI: 1.234-1.424, P < 0.001). The Egger test (P = 0.10092) and the Begg
test (P = 0.0509) revealed no publication bias. The result of one-year survival rate was shown in [Figure 4].