Page 128 - Read Online
P. 128

Page 4 of 7                                                   Umar et al. Hepatoma Res 2018;4:71  I  http://dx.doi.org/10.20517/2394-5079.2018.31


                          100
                                                            96.1%
                           90
                                       86.11%
                                                                                83.33%
                           80
                           70
                           60

                           50
                           40
                           30

                           20

                           10
                            0
                                        RVR                 ETR                   SVR
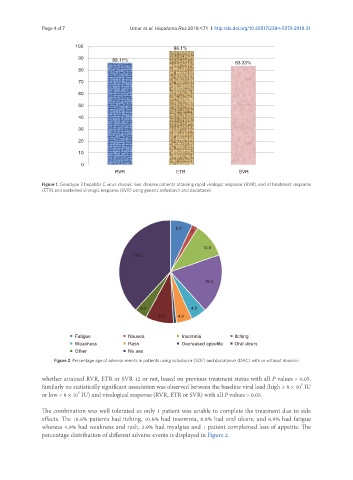
               Figure 1. Genotype 3 hepatitis C virus chronic liver disease patients attaining rapid virologic response (RVR), end of treatment response
               (ETR) and sustained virologic response (SVR) using generic sofosbuvir and daclatasvir


                                                            6.9
                                                                 2

                                                                     10.8
                                              38.2


                                                                      18.6


                                                3.9              4.9
                                                       8.8   4.9
                                                           1

                          Fatigue           Nausea            Insomnia          Itching
                          Weakness          Rash              Decreased appetite  Oral ulcers
                          Other             No aes
                   Figure 2. Percentage age of adverse events in patients using sofosbuvir (SOF) and daclatasvir (DAC) with or without ribavirin


               whether attained RVR, ETR or SVR 12 or not, based on previous treatment status with all P values > 0.05.
                                                                                                       5
               Similarly no statistically significant association was observed between the baseline viral load (high ≥ 8 × 10  IU
                           5
               or low < 8 × 10  IU) and virological response (RVR, ETR or SVR) with all P values > 0.05.
               The combination was well tolerated as only 1 patient was unable to complete the treatment due to side
               effects. The 18.6% patients had itching, 10.8% had insomnia, 8.8% had oral ulcers, and 6.9% had fatigue
               whereas 4.9% had weakness and rash, 3.9% had myalgias and 1 patient complained loss of appetite. The
               percentage distribution of different adverse events is displayed in Figure 2.
   123   124   125   126   127   128   129   130   131   132   133